(1) STUDY DESIGN: This study is experimental, with pre-test and post-test measurements in four independent groups. Some questions we might ask of the data are:
(2) DATA ENTRY AND VALIDATION: Care should be taken in creating and naming variables and entering data. Data should be validated for accuracy.
(3) GROUPS AT BASELINE:
Summary Statistics
BASELINE
| GROUP | Mean | n | Std. Deviation | Minimum | Maximum | Median |
| 1 | 90.67 | 3 | 8.39 | 81 | 96 | 95.00 |
| 2 | 94.33 | 3 | 33.08 | 60 | 126 | 97.00 |
| 3 | 81.67 | 3 | 15.28 | 65 | 95 | 85.00 |
| 4 | 96.00 | 3 | 2.65 | 94 | 99 | 95.00 |
| Total | 90.67 | 12 | 17.00 | 60 | 126 | 95.00 |
| Sum of Squares | df | Mean Square | F | Sig. | |||
| BASELINE * GROUP | Between Groups | (Combined) | 368.667 | 3 | 122.889 | .350 | .791 |
| Within Groups | 2810.000 | 8 | 351.250 | ||||
| Total | 3178.667 | 11 |
(4) CHANGE IN MIQ SCORES WITHIN GROUPS - ANSWERS NOT SHOWN
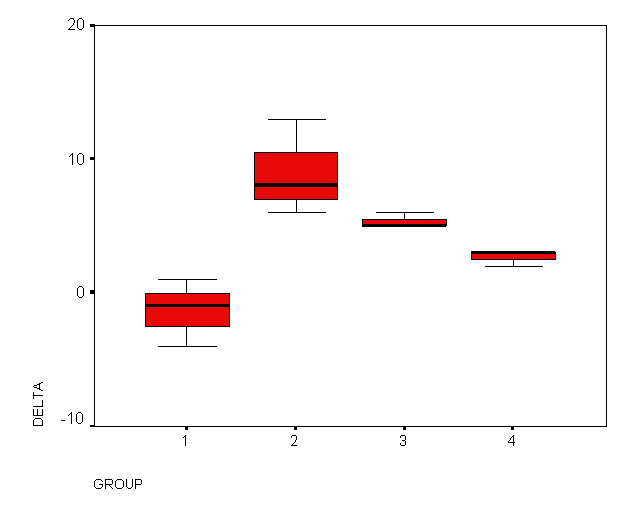
(5) ANALYSIS OF GROUP DIFFERENCES AT 12 WEEKS POST INTERVENTION
DELTA
| GROUP | Mean | n | Std. Deviation | Minimum | Maximum | Median |
| 1 | -1.33 | 3 | 2.52 | -4 | 1 | -1.00 |
| 2 | 9.00 | 3 | 3.61 | 6 | 13 | 8.00 |
| 3 | 5.33 | 3 | .58 | 5 | 6 | 5.00 |
| 4 | 2.67 | 3 | .58 | 2 | 3 | 3.00 |
| Total | 3.92 | N = 12 | 4.38 | -4 | 13 | 4.00 |
ANOVA Table
| Sum of Squares | df | Mean Square | F | Sig. | |||
| DELTA * GROUP | Between Groups | (Combined) | 170.917 | 3 | 56.972 | 11.394 | .003 |
| Within Groups | 40.000 | 8 | 5.000 | ||||
| Total | 210.917 | 11 |
Post-Hoc Multiple Comparisons w/ Bonferroni's Method; s2w = 5.00, dfw = 8
| Mean Difference (I-J) | Std. Error | tstat | p | Sig | ||
| (I) GROUP | (J) GROUP | |||||
| 1 | 2 | -10.33 | 1.83 | .017 | Y | |
| 3 | -6.67 | 1.83 | Y | |||
| 4 | -4.00 | 1.83 | N | |||
| 2 | 3 | 3.67 | 1.83 | N | ||
| 4 | 6.33 | 1.83 | N | |||
| 3 | 4 | 2.67 | 1.83 | N |
* The mean difference is significant at the .05 level.