12.1 Weight gain and junk food. The dependent variable is weight gain (grams) and the independent variable is diet type (1 = standard diet, 2 = junk food, 3 = health food). The study was done in laboratory mice (for obvious reasons); there are 5 mice per group (small sample). The study was set up to learn about the effect of diet on weight gain.
(A) Means and standard deviations
n1 = 5,
1 = 11.14, s1 = 1.27
n2 = 5,2 = 13.44, s2 = 0.623
n3 = 5,3 = 9.14, s3 = 0.581
(B) Boxplot: Locations (averages) demonstrate clear differences. The
small samples ( ni = 5) preclude robust statements
about shape and location.
(C) Replicate descriptive statistics and boxplot in SPSS
(D) ANOVA calculations
To determine the approximate P-value, draw the F2,12 curve and then look up the landmark for alpha = 0 .05 in the F table, which is F2,12,.95 = 3.89. You should place the landmark on the curve, noting that the area under the curve to the right of this landmark is .05. Then put the Fstat (which is 29.69) far to the right of the landmark. The area under the curve to the right of the Fstat should be shaded to represent the p value. It should be clear now that p < .05. The precise P-value (StaTable) @ 0.000.
The conclusion is to reject H0 and conclude the average differed significantly.
ANOVA table:
Source SS df MS
Between 46.30 2 23.15
Within 9.37 12 .78
(E) Replicate ANOVA in SPSS.
12.3 Maternal adaptation.
(A) Explore the data with side-by-side boxplots. The SPSS boxplots are shown below. (The labels on the X-axis failed to print in the transfer to html. Here are the group descriptions we are going to have to keep in mind when interpreting these data: Group 1 = LBW + intervention, Group 2 = LBW + no intervention, Group 3 = normal birth weight, no intervention.)

Report the most salient findings from this exploration. Side-by-side boxplots reveal outside values in Group 1 (LBW + intervention) and Group 3 (normal BW + no intervention). Group 2 (LBW + no intervention) shows higher average values than both Group 1 or Group 3.
What do you make of the outside values? These outside values represent women with high scores -- women having excessive trouble adapting to motherhood -- and should be investigated.
(B) Group summary statistics are given in the problem. Construct a one-way ANOVA table based on thee summary statistics. See below.

Report the F statistic and P-value used to test H0: �1 = �2 = �3. Fstat = 5.53 with 2 and 90 df; P = 0.005. Therefore, the difference among groups is significant.
(C) In rejecting H0, are you concluding that all three groups differ? No!
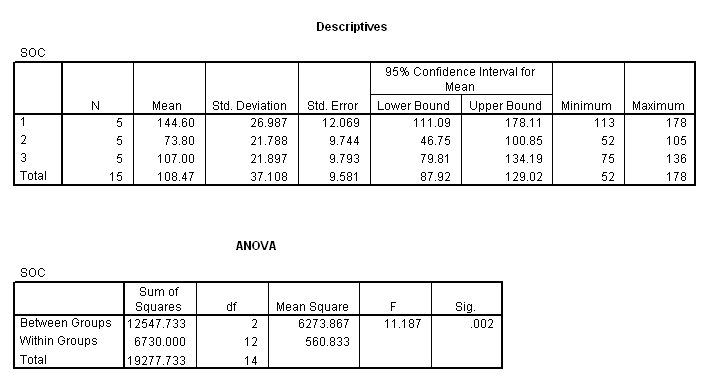
12.5 Sense of coherence
(A) Boxplots
