Report #3a
California�s Tax System �
Personal
Income Tax Weakness & Possible Remedies:
Volatility is Too Great
"Know New Taxes" (a look at environmental taxes), SF Chronicle, 9/19/07
Annette
Nellen
Tax
Professor at
Introduction
The personal
income tax (PIT) is the largest revenue generator for
The California
PIT is computed starting with federal adjusted gross income (AGI) with
various adjustments. The graduated rate structure is comprised of 6 rates:
1%, 2%, 4%, 6%, 8%, and 9.3%. In addition, individuals with taxable income
over $1 million must pay an additional 1% on the amount over $1 million.
This additional tax is designated as a mental health services tax.[3]
The 10.3%
maximum tax rate (9.3% + 1% special tax) represents the highest maximum
rate among the states. The top tax rates and number of tax brackets for
selected states follows.[4]
|
State |
Top
rate |
Top
rate applies to income over |
#
of tax brackets |
|
|
9.3% 10.3% |
$86,934 $1,000,000 |
7 |
|
|
4.63% |
Flat
tax |
1 |
|
|
8.25% |
$96,000 |
9 |
|
|
3.0% |
Flat
tax |
1 |
|
|
8.98% |
$60,436 |
9 |
|
|
7.85% |
$123,751 |
3 |
|
|
6.85% |
$40,000 |
5 |
|
|
9.00% |
$13,702 |
3 |
|
|
9.5% |
$336,551 |
5 |
Because the PIT
is a very significant revenue generator for
|
State |
PIT |
Corp.
Income Tax |
Sales/Use
Tax |
Licenses |
Property
Tax |
Other |
|
|
46.0% |
9.3% |
35.9% |
6.8% |
2.0% |
<
1% |
|
|
50.0% |
5.4% |
38.2% |
3.9% |
0% |
2.5% |
|
|
30.7% |
8.5% |
50.4% |
8.8% |
< 1% |
1.4% |
|
|
54.1% |
9.6% |
30.6% |
3.4% |
< 1% |
2.3% |
|
|
26.3% |
8.0% |
48.9% |
5.8% |
9.4% |
1.6% |
|
|
56.5% |
7.4% |
29.9% |
2.4% |
0% |
3.8% |
|
|
40.4% |
4.5% |
46.5% |
8.6% |
< 1% |
< 1% |
|
|
0% |
0% |
77.4% |
13.8% |
0% |
8.8% |
|
|
52.8% |
5.0% |
33.3% |
3.7% |
< 1% |
5.1% |
|
State
total |
34.6% |
6.7% |
46.7% |
6.4% |
1.7% |
3.9% |
Weakness:
Remedy:
Reduce the volatility by replacing some portion of the PIT with other
taxes and lower the threshold at which individuals become subject to PIT
in conjunction with providing other tax relief for low-income taxpayers.
Extent and Causes of the
Volatility
Exemptions and
tax credits significantly lower PIT liability for many Californians. That
leaves more of the tax to be collected from higher income individuals. In
2006, a married couple with two dependents did not owe
The Center for
Budget and Policy Priorities reports that
|
State |
Single-parent/2
children |
Married
parents/2 children |
|
|
$4,600 |
$4,600 |
|
|
$11,100 |
$14,400 |
|
|
$13,600 |
$15,600 |
|
|
$14,600 |
$17,500 |
|
|
$24,300 |
$26,200 |
|
|
$32,500 |
$36,300 |
|
|
$42,400 |
$44,700 |
|
Average
of states |
$19,400 |
$22,500 |
|
Poverty
line |
$16,079 |
$20,615 |
In 2004,
Californians with adjusted gross income (income before most deductions)
over $100,000 paid 80% of the PIT collected by the state while roughly 64%
of individuals with income under $50,000 paid about 3% of the PIT. The
breakdown showing number of taxpayers and the percent of total PIT paid by
that income group is shown in the following chart from the Governor�s
2007-2008 budget report.[9]
These figures
indicate that the PIT primarily applies to top income producers. This
dependence on collecting a significant portion of tax revenues from a
small number of individuals though is risky so far as ensuring a stable
revenue base. When there is a drop in the income of the top 10% of
income-generators, as can easily happen in a weak economy, the entire
state is impacted due to a drop in its largest revenue source. As noted in
the Governor�s 2007-2008 budget report: �Changes
in the income of a relatively small group of taxpayers can have a
significant impact on state revenues.�[10]
This is what happened in the �dot.com� boom and bust several years
ago.
The �dot.com� boom generated larger than usual
stock option spreads for many individuals as well as larger than usual
capital gains from the sale of stock. The LAO reported that in 1999,
income from capital gains and stock options increased about 50%, and
increased 30% in 2000.[11]
Then with the �dot.com bust,� this revenue dropped. The unevenness of
capital gain and stock option income is illustrated in the LAO chart
below.[12]
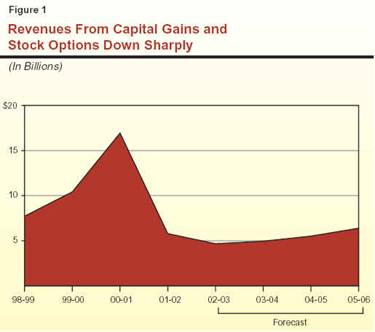
The situation as described by the LAO:
�The dramatic impact of the stock market decline
is depicted in Figure 1, which shows the amount of personal income
taxes attributable to stock options and capital gains. It indicates that
these tax revenues peaked at $17 billion in 2000-01, but fell
abruptly following the stock market decline�to under $6 billion in
2001-02. This unprecedented 66 percent decline is the key factor
behind the $10-plus billion annual mismatch between revenues and
expenditures that began in 2001-02.�[13]
The following chart, also from the LAO, shows the
breakdown in capital gain and stock option income.[14]

The LAO report noted that in 2000, the over $17
billion of taxes paid on capital gains and stock option income represented
over 22% of total General Fund revenues. The LAO projected that due to a
declining stock market, these sources of PIT would decrease about $10
billion in the subsequent year.[15]
In
summary, factors that make the PIT volatile are:
- Reliance on a small
number of high-income taxpayers to generate a significant portion of
the PIT revenue.
- The effect of
unpredictable and uneven stock gains on the PIT base.
- Bracket compression
that causes the 9.3% bracket to start at roughly $87,000 (in 2006).
- A large portion of the
aggregate AGI base not being subject to PIT.
Why Volatility
Should Be Addressed
A
revenue base that is stable and predictable helps legislators and the
governor make spending decisions and determine whether tax law changes are
needed. A volatile tax that at times generates more revenue than expected
can lead to spending problems if there are no provisions or efforts to
either set the extra revenue aside for a future time when PIT collected is
less than expected, or to use the extra revenue for one-time spending
(rather than base spending).
Challenges
The
remedies for volatility problem are not ones that would be easy to
implement. Also, solutions would need to be implemented in conjunction
with other changes to keep tax collections steady.
Recommendations for
Reducing Volatility
A
combination of changes is needed to reduce the volatility in the PIT. The
PIT needs to be collected from more taxpayers. That is, more aggregate
income needs to be subject to PIT. The volatility could also be reduced by
reducing the slice of the total tax revenue pie attributable to the PIT.
Following are techniques for spreading out collection of PIT and reducing
the state�s reliance on this tax.
- Stretch out the PIT
rate structure so that a low rate applies to lower income individuals.
For example, apply the 1% rate (or perhaps drop the lowest rate to
0.5%) to lower levels of taxable income. Then apply the 2% rate to a
higher income level as well as the 4% rate and so on until the 9.3%
rate applies to higher levels of taxable income than is the case now.
- Add new taxes, such as
on energy use, that apply to high levels of usage, such as might be
the case for individuals with large homes (see Report #11). In
addition, the sales tax base should be broadened and the rate lowered
(see Report #2a). These changes would replace the revenue lost by
reducing PIT collections.
Other techniques for
reducing volatility include:
- Reduce the tax rate on
capital gain income since that is the most volatile type of income
currently subject to tax. Other changes would be needed to replace any
lost revenue.
- Modify the PIT formula
such that the amount owed is a percentage of the federal income tax
liability, lower the amount collected and make up the difference with
increased sales taxes (through base broadening) or alternative taxes.
Tax
Policy Analysis[16]
The following chart explains how reducing volatility of the PIT would
satisfy the principles of good tax policy. The rating in the last column
indicates how change to reduce volatility would improve the current
system.
|
Principle |
Application
and Analysis |
Rating |
|
Fairness |
||
|
Equity
and Fairness |
The current PIT has a high degree of
vertical equity (those with higher incomes pay significantly and
proportionally more than those with lower income). Many individuals
with income do not pay any PIT though which hurts vertical equity. |
+ |
|
Transparency
and Visibility Taxpayers should know that a tax exists and how and when it is imposed upon them and others. |
no change | |
|
Operability |
||
|
Certainty |
No change |
|
|
Convenience
of Payment |
No change |
|
|
Economy
in Collection |
No change |
|
|
Simplicity |
No change |
|
|
Minimum
Tax Gap |
If more taxpayers become subject to
paying PIT, the tax gap might increase. |
- |
|
Appropriate
Government Revenues |
Reducing the volatility of the PIT would
make this tax a more predictable revenue source for the State. |
+ |
|
Appropriate
Purpose and Goals |
||
|
Neutrality |
No
change |
|
|
Economic
Growth and Efficiency |
A
more stable revenue source should stabilize spending and reduce the
likelihood of budget deficits. |
+ |
[1]
Legislative Analyst�s Office (LAO), Analysis
of the 2007-08 Budget Bill: Perspectives
and Issues (perspectives on state
revenues); available at http://www.lao.ca.gov/laoapp/analysis.aspx?year=2007&chap=8&toc=1.
[2]
LAO, Reforming California�s Tax System, 1/22/04, pg. 4; available at
http://www.lao.ca.gov/handouts/fo/2004/Reforming_California_Tax_System.pdf.
[3]
This tax was created by Proposition 63, passed by voters in 2004. This
report includes this 1% rate as part of the PIT because it is computed
using
[4]
Information from Federation of Tax Administrators, as of 1/1/07;
available at http://www.taxadmin.org/fta/rate/ind_inc.html.
[5] See next section for references.
[6]
From the U.S. Census Bureau, State Tax Collections 2006; available at http://www.census.gov/govs/www/statetax06.html.
This data includes various license revenue in the tax collection data
which is why
[7]
See 2006 exemption amounts and tax rates at http://www.ftb.ca.gov/forms/06_forms/06_540bktoc.asp.
[8]
Jason A. Levitis, Center for Budget and Policy Priorities, The Impact
of State Income Taxes on Low-Income Families in 2006, 3/27/07, pg 12;
available at http://www.cbpp.org/3-27-07sfp.pdf.
[9]
Governor�s Budget 2007-2008, General Fund Revenue; available at http://www.ebudget.ca.gov/BudgetSummary/REV/26639985.html.
[10] Governor�s Budget 2007-2008, General Fund Revenue; available at http://www.ebudget.ca.gov/BudgetSummary/REV/26639985.html.
[11]
LAO, California�s Fiscal Outlook, LAO
Projections, 2000-01 Through 2005-06, Chapter 3 Revenue
Projections, 11/15/00; available at http://www.lao.ca.gov/2000/fisc_outlook/111500_fiscal_outlook_chapter_3.html.
[12]
LAO,
California
�s
Fiscal Outlook, LAO Projections, 2002-03 Through 2007-08, 11/14/02;
available at http://www.lao.ca.gov/2002/fiscal_outlook/fiscal_outlook_2002.html.
[13]
[14]
LAO,
[15]
[16]
This analysis uses a document prepared by the American Institute of
Certified Public Accountants (AICPA) Tax Division and altered to the
above format by Joint Venture: Silicon Valley Network. The AICPA
document, Guiding Principles of
Good Tax Policy: A Framework for Evaluating Tax Proposals (2001)
is available at http://ftp.aicpa.org/public/download/members/div/tax/3-01.pdf.
The Joint Venture workbook is available at http://www.jointventure.org/PDF/taxworkbook.pdf.
The principles laid out in these documents are frequently used
tax policy analyses ones. For more information see Nellen, Policy
Approach to Analyzing Tax Systems; available at http://www.cob.sjsu.edu/facstaff/nellen_a/Policy%20Approach%20to%20Analyzing%20Tax%20Systems.pdf.
Note: The author of this report (Annette Nellen) was the lead author
for both the AICPA and Joint Venture documents noted here.