Driving Informed Decision-Making with Spatial Analytics & Visualization!
Welcome to the Spatial Analytics and Visualization Institute (SAVI) page, an official SJSU Campus Institute in the California State University system. We are the only CSU Institute in Northern California to implement advanced GISci techniques for inclusive development, environmental health, and civic infrastructure research and education! SAVI uses the power of geography and Geographic Information Science to provide impactful research and professional services that optimize resource distribution, enhance social mobility, and uphold democratic values to serve the Silicon Valley and Bay Area communities.
News


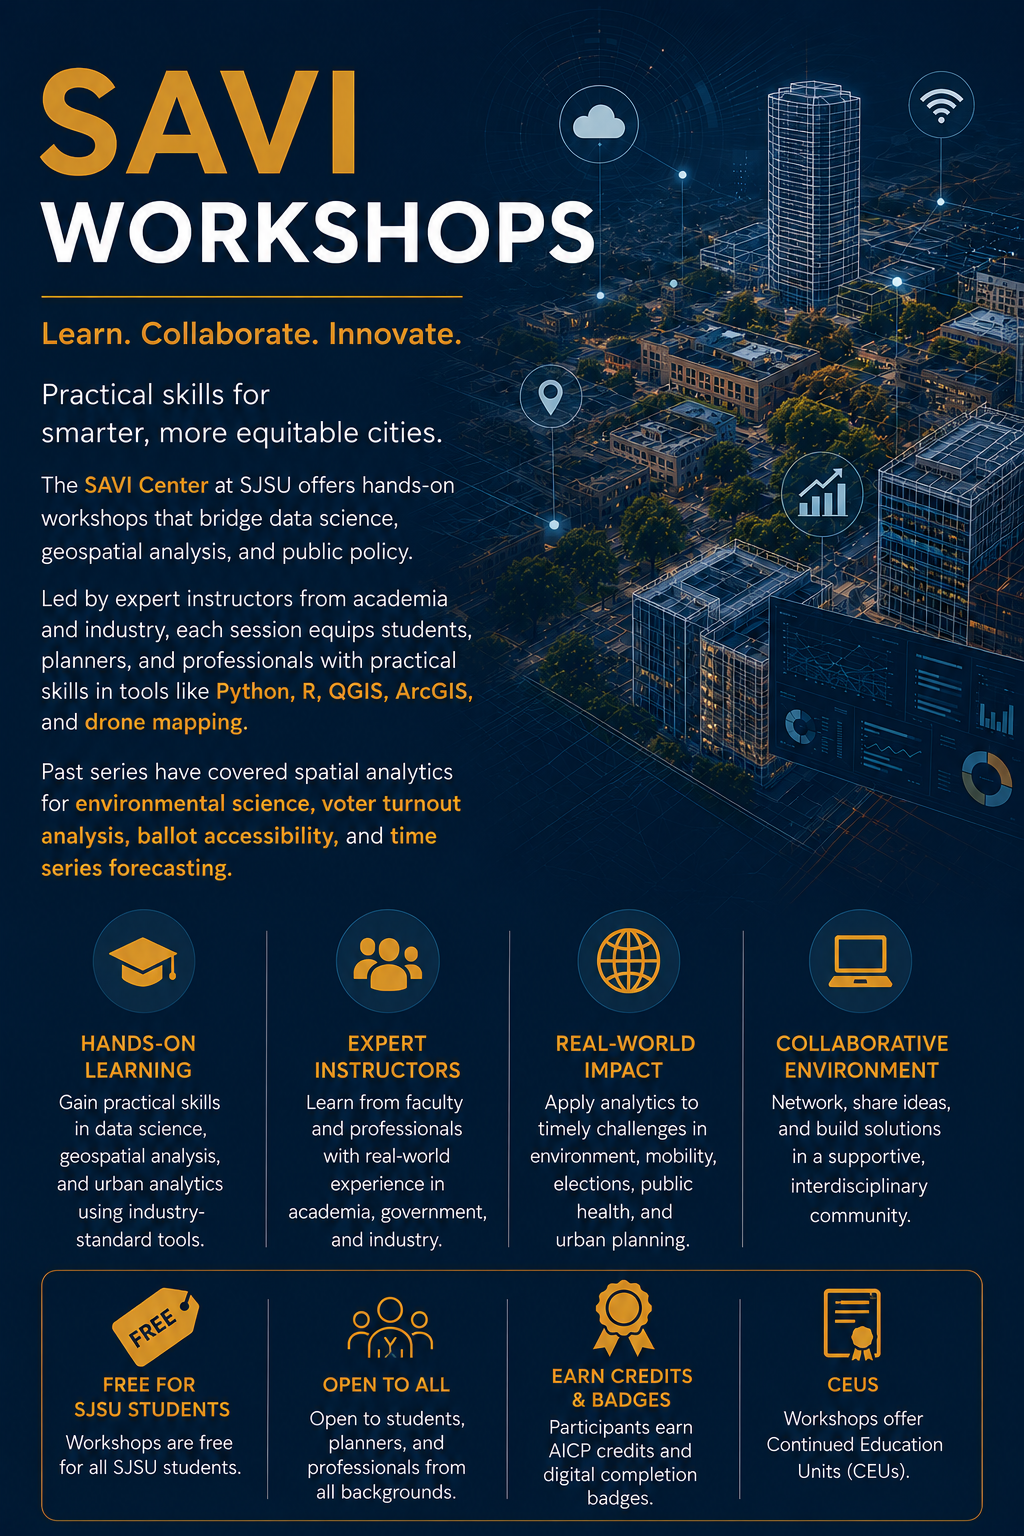
SAVI Workshops: Build Skills for the Spatial Age
The SAVI Center at San José State University offers hands-on workshops that connect data science, geospatial analysis, urban analytics, and public policy through applied and collaborative learning experiences. Led by expert instructors from academia, government, and industry, SAVI workshops provide practical training in tools and methods such as Python, R, QGIS, ArcGIS Pro, web mapping, drone mapping, spatial visualization, machine learning, and AI applications for urban and environmental analysis. Past workshop series have explored topics including voter turnout analysis, ballot accessibility, environmental justice, transportation and mobility analytics, smart cities, GIS for planning and public health, and time series forecasting. Sessions range from short skill-building workshops and half-day intensives to multi-day bootcamps and are offered in in-person, online, and hybrid formats to support flexible participation. Open to students, planners, researchers, professionals, and community members, SAVI workshops foster interdisciplinary collaboration and real-world technical skill development. Many workshops are free for SJSU students, and participants may earn AICP credits, digital completion badges, and Continuing Education Units (CEUs).
Upcoming Event

Past Events
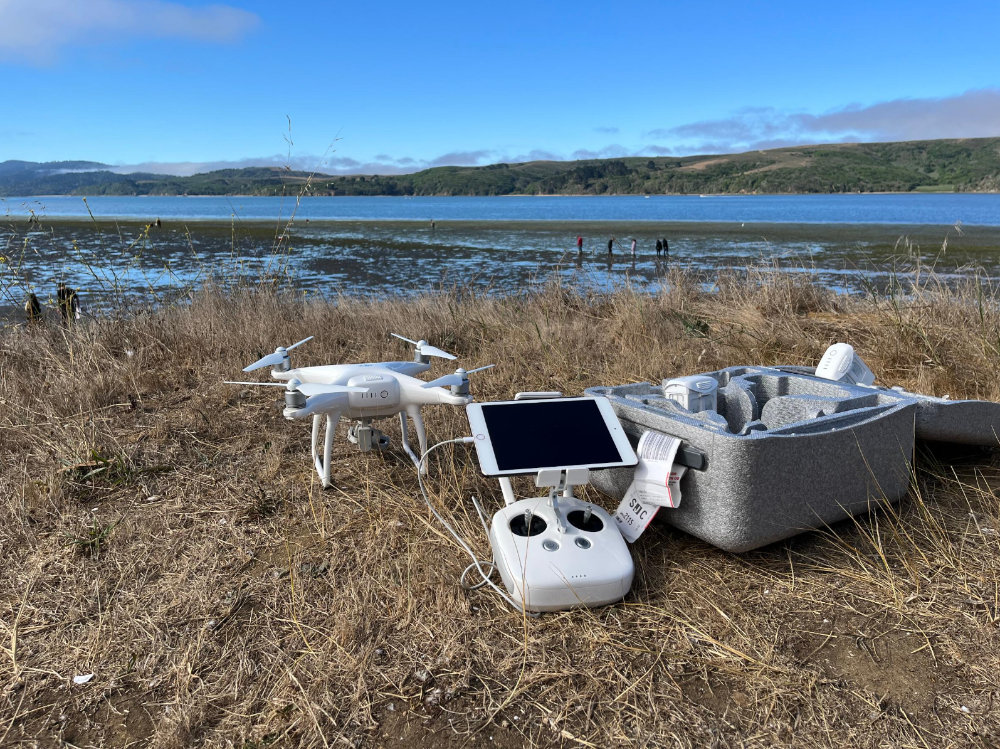
Coastal ecosystems and eelgrass habitats provide important services to the marine environment, including primary production, carbon storage, nutrient cycling, habitat for fisheries species, and erosion control. UASs with high spatial resolution, temporal flexibility, and cost-effectiveness for repeat photogrammetry, afford a significant advancement in other remote sensing approaches for coastal mapping, habitat monitoring, and environmental management. They provide essentially on-demand remote sensing at low cost and with reduced human risk. Drone imagery will be collected at least annually in coordination with in situ samplings which will also be used to validate the imagery by ground-truthing across a range of points within each meadow. Because eelgrass extent in some regions is subtidal and challenging to visualize from the air, we utilize DJI Phantom 4 Pro (RGB) and DJI Inspire (multispectral) drones and related drone mapping technology through Esri Drone2Map. Each year, ideally we allocate 4-6 days at each site for each drone mission to maximize ideal conditions for collecting drone imagery, striving for lowest spring tides, and calm, bright conditions with roughly vertical sunlight.